|
How to read the Shift-Speed graphs
In these graphs you can see your speeds when shifting gear at the optimal RPM,
initially the M.P.RPM.
-
First you
pull up to this RPM in 1st gear and reach speed X in gear 1.
-
Then you
shift to second gear and -assuming there are no losses- you hold that
same speed but your engine makes less RPM because you are now in higher
gear.
-
Now you
start to build up the revs again until the Shift-RPM and shift to 3rd
gear. And so on...
This is
what you see in these graphs. But all of this is theoretically because
when you shift gear, you are going to loose some speed. But for
comparison between setups, this loss can be eliminated.
So you can see the effect of changing sprockets on the speed range you
have in each gear. Changing sprockets does not only change your top
speed, it also changes the speed range for each gear.
This speed range is the range from shifting to this gear until
shifting to the next gear. This speed range changes when changing
sprockets:
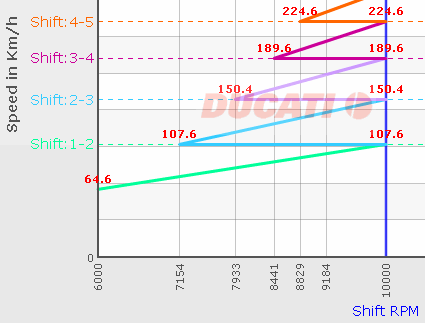
In the
above graph you shift from 2nd to 3rd gear at 150.4 km/h and from
3rd to 4th at 189.6 km/h. After changing sprockets (from 36/15 to
39/15) the following shift speeds apply:
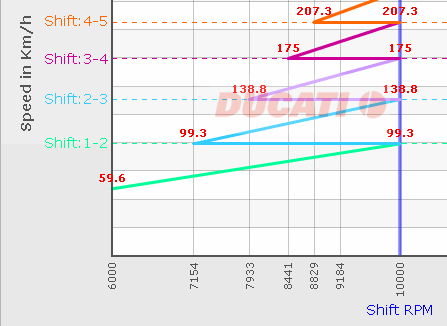
From 2nd
to 3rd at 138.8 km/h and from 3rd to 4th at 175 km/h. So
not only will the top speed be lower, also the 'shift speeds' are lower.
Of course a better way to influence shift speeds is to change to gear
ratio per gear but mostly that is not possible unless you apply major
surgery to your gearbox. By changing sprockets it is also possible to
change shift speeds and adapt them to the race track circumstances.
If you want to display
the graph at another Shift-RPM range, change the M.P.RPM in Custom
setup.
If you want to display
these Shift-Speed graphs for other sprockets, go back to the main page
and change sprockets as you like in all 3 setups or just in 1 or 2 of
them.
You can print the graph by hovering over the graph and right click. When
using the Stand Alone version of the Gearing Commander you can save the
graphs as PNG, JPG or PDF file the same way.
By hovering the cursor
over the intersection of vertical RPM grid lines and the colored speed
lines, the corresponding RPM and Speed is shown for that gear.
You can
print the graph by clicking the 'Print All Graphs'-button. The 3 graphs
will be printed on separte pages. If you select your installed 'print to
pdf'-printer, you can save the graphs as PDF-files.
Next:
Sprocket
Combo Graph
Back to
Gearing Commander main page
|